Chart o’ the Day: Stocks are Not Expensive

Savita Subramanian’s Quant Strategies group at BAML took a look at some of the most popular valuation metrics to determine whether or not the US stock market was as expensive as many have been claiming of late.

14 of 15 measures say S&P 500 is fair to undervalued
We have examined a broad universe of valuation metrics to assess whether any are
suggesting the market is overvalued. Of the 15 valuation metrics we analyze, only
one suggests that stocks are expensive vs. history. The majority indicate that the
market is still trading below or in-line with historical norms, suggesting that the rally
has chiefly been driven by a recovery in multiples from very depressed levels. Of the
most commonly cited metrics, stocks are still trading at a discount to history on Price
to Earnings (trailing, forward and normalized), Price to Book, EV/EBITDA and P/E to
Growth. See Table 1 inside for details.

stocks cheap

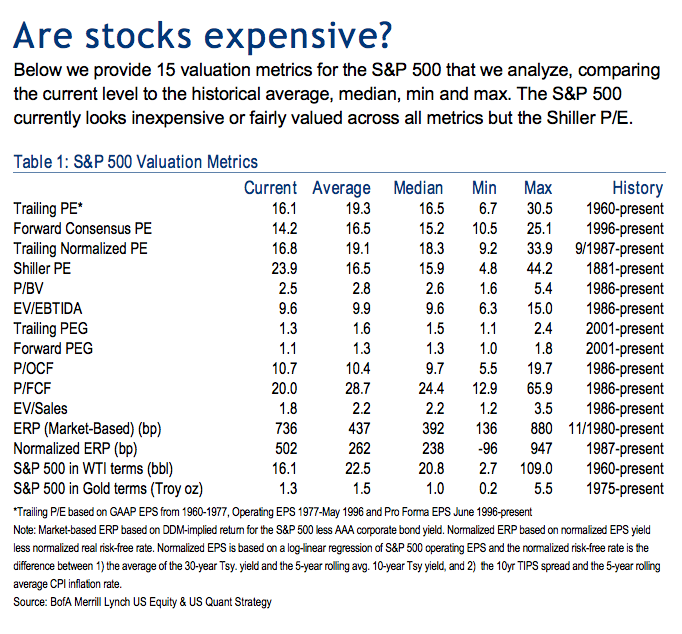
Josh here – the 15th measure, Shiller CAPE, does suggest we are expensive – but it is dismissible because the dragdown from 2008 produces an earnings number of $70, worse than even a recessionary atmosphere would generate, in Subramanian’s view.

Matt Boesler beat me to this chart, his write up is here:

BofA: ‘The Market Is Far From Overvalued’ Based On Almost Every Popular Metric (Business Insider)

This content, which contains security-related opinions and/or information, is provided for informational purposes only and should not be relied upon in any manner as professional advice, or an endorsement of any practices, products or services. There can be no guarantees or assurances that the views expressed here will be applicable for any particular facts or circumstances, and should not be relied upon in any manner. You should consult your own advisers as to legal, business, tax, and other related matters concerning any investment.

The commentary in this “post” (including any related blog, podcasts, videos, and social media) reflects the personal opinions, viewpoints, and analyses of the Ritholtz Wealth Management employees providing such comments, and should not be regarded the views of Ritholtz Wealth Management LLC. or its respective affiliates or as a description of advisory services provided by Ritholtz Wealth Management or performance returns of any Ritholtz Wealth Management Investments client.

References to any securities or digital assets, or performance data, are for illustrative purposes only and do not constitute an investment recommendation or offer to provide investment advisory services. Charts and graphs provided within are for informational purposes solely and should not be relied upon when making any investment decision. Past performance is not indicative of future results. The content speaks only as of the date indicated. Any projections, estimates, forecasts, targets, prospects, and/or opinions expressed in these materials are subject to change without notice and may differ or be contrary to opinions expressed by others.

Wealthcast Media, an affiliate of Ritholtz Wealth Management, receives payment from various entities for advertisements in affiliated podcasts, blogs and emails. Inclusion of such advertisements does not constitute or imply endorsement, sponsorship or recommendation thereof, or any affiliation therewith, by the Content Creator or by Ritholtz Wealth Management or any of its employees. Investments in securities involve the risk of loss. For additional advertisement disclaimers see here: https://www.ritholtzwealth.com/advertising-disclaimers

Please see disclosures here.

What's been said:

Discussions found on the web
  1. Regression Testing commented on Feb 07

    … [Trackback]

    […] Info on that Topic: thereformedbroker.com/2013/08/09/chart-o-the-day-stocks-are-not-expensive/ […]