
Here’s why your politics and your investing outlook should never ride the same short-bus to that special school they’re enrolled in – the conventional wisdom about George W. Bush was that his “business experience” would mean a great boon to Corporate America and US businesses. Now of course, his laissez-faire policies of delegate and deregulate meant the end of the world for US companies as the free-for-all eventually took us off the cliff, but we’ll stop right there and get to Barack Obama.
The socialist Muslim President from Kenya was supposed to have been horrible for businesses and for the stock market and especially for rich people. “If Obama wins,” went the rhetoric in 2008, “we’re all screwed.”
Only the opposite happened.
The stock market, since Obama’s first election, has doubled in price and then some. Shareholders have received trillions in capital gains, stock buybacks and dividends as corporations find their cups runnething over and over and literally run out of places to stash all the extra profits and retained earnings.
And wealthy American households have never had it quite so good. In the aggregate, they have become rentiers, the French term for those with investment portfolios who essentially extract an income from the nation and return very little (in the form of jobs or spending) in comparison to what they take.
The recovery for the top 7% of US households (the wealthiest 8 million homes) has so completely exceeded the recovery of the bottom 93% that it’s laughable we all inhabit the same country – a night and day comeback indeed. In fact, from 2009 through 2011, according to census data and Pew Research, the bottom 93% of the country actually saw their assets shrink!
One could only look at the robust recovery for the top 7% side-by-side with the non-recovery of everyone else and conclude that Barack Obama has presided over one of the most winningest periods for the wealthy in US history and is akin to some kind of reverse Robin Hood, enriching the rich while the poor are evicted from their homes and remain jobless.
The unbelievable supporting evidence, from a new Pew Research report, is below:
Gains Non-Existent for the Bottom 93% through 2011
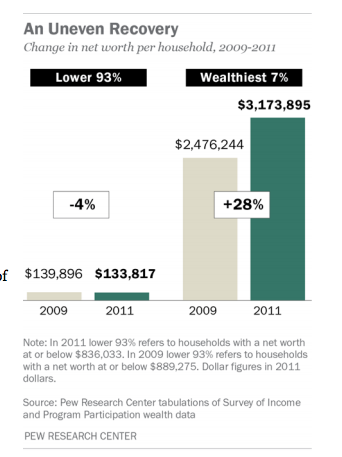
During the first two years of the nation’s
economic recovery, the mean net worth of
households in the upper 7% of the wealth
distribution rose by an estimated 28%, while
the mean net worth of households in the lower
93% dropped by 4%, according to a Pew
Research Center analysis of newly released
Census Bureau data.From 2009 to 2011, the mean wealth of the 8
million households in the more affluent group
rose to an estimated $3,173,895 from an
estimated $2,476,244, while the mean wealth of
the 111 million households in the less affluent
group fell to an estimated $133,817 from an
estimated $139,896.
If ANything, Wealthy Homes Took “Share” of the Nation’s Assets
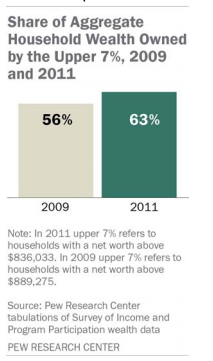
Wealth inequality increased during the first two years of the
recovery. The upper 7% of households saw their aggregate share of the nation’s overall
household wealth pie rise to 63% in 2011, up from 56% in 2009. On an individual household
basis, the mean wealth of households in this more affluent group was almost 24 times that of
those in the less affluent group in 2011. At the start of the
recovery in 2009, that ratio had been less than 18-to-1.
The Key Was to Have a Portfolio, Which Only Already-Wealthy People Really Do
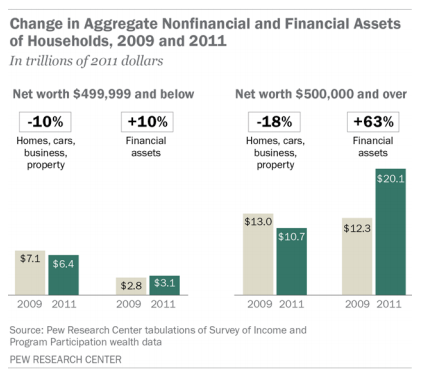
The different performance of financial asset and housing markets from 2009 to 2011 explains virtually all of the variances in the trajectories of wealth holdings among affluent and less affluent households during this period.Among households with net worth of $500,000 or more, 65% of their wealth comes from financial holdings, such as stocks, bonds and 401(k) accounts, and 17% comes from their home. Among households with net worth of less than $500,000, just 33% of their wealth comes from financial assets and 50% comes from their home.
The Gains from 2009 Were Not Equally Distributed At All
 The total stock of household wealth in the U.S. increased $5.0 trillion from 2009 ($35.2 trillion) to 2011 ($40.2 trillion); all of these aggregate gains, and more, went to households in the upper 7%. In 2009 households with a net worth of $889,275 and below (the lower 93%) had an estimated $15.4 trillion in wealth.
By 2011, households in the lower 93%
had $14.8 trillion in wealth. Meanwhile, at the
top of the wealth pyramid, the aggregate
wealth of the upper 7% rose from an estimated
$19.8 trillion in 2009 to $25.4 trillion in 2011
(a $5.6 trillion increase).As a result, the upper
7% of households owned 63% of the nation’s
total household wealth in 2011, up from 56% in 2009.
Through the End of 2011, You Can Basically Point to the Portfolios of the Wealthy as Having Benefited
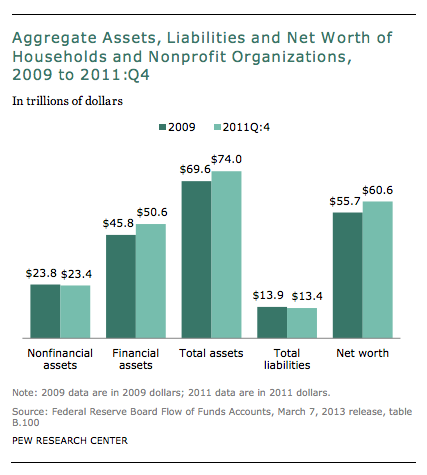 As with the Census data, the Fed data show a rise in wealth from 2009 to the fourth quarter of 2011. Likewise, the Fed data indicate that most of the growth in the nation’s wealth during that period was due to an increase in the value of financial assets. From 2009 to the fourth quarter of 2011,financial assets increased in value by $4.8 trillion (from $45.8 trillion to $50.6 trillion), accounting for nearly all of the $4.9 trillion increase in the nation’s net worth of households and nonprofit organizations.
Full report below:


… [Trackback]
[…] Read More here on that Topic: thereformedbroker.com/2013/04/24/the-reverse-robin-hood-recovery/ […]
… [Trackback]
[…] Read More here to that Topic: thereformedbroker.com/2013/04/24/the-reverse-robin-hood-recovery/ […]
… [Trackback]
[…] Info on that Topic: thereformedbroker.com/2013/04/24/the-reverse-robin-hood-recovery/ […]
… [Trackback]
[…] Read More Info here to that Topic: thereformedbroker.com/2013/04/24/the-reverse-robin-hood-recovery/ […]
… [Trackback]
[…] Read More on that Topic: thereformedbroker.com/2013/04/24/the-reverse-robin-hood-recovery/ […]
… [Trackback]
[…] Read More on that Topic: thereformedbroker.com/2013/04/24/the-reverse-robin-hood-recovery/ […]
… [Trackback]
[…] Read More to that Topic: thereformedbroker.com/2013/04/24/the-reverse-robin-hood-recovery/ […]
… [Trackback]
[…] Read More on that Topic: thereformedbroker.com/2013/04/24/the-reverse-robin-hood-recovery/ […]
… [Trackback]
[…] Information to that Topic: thereformedbroker.com/2013/04/24/the-reverse-robin-hood-recovery/ […]
… [Trackback]
[…] Find More on to that Topic: thereformedbroker.com/2013/04/24/the-reverse-robin-hood-recovery/ […]
… [Trackback]
[…] Read More here to that Topic: thereformedbroker.com/2013/04/24/the-reverse-robin-hood-recovery/ […]
… [Trackback]
[…] Read More to that Topic: thereformedbroker.com/2013/04/24/the-reverse-robin-hood-recovery/ […]