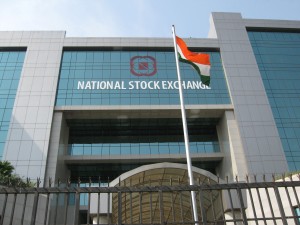
Today we have a very special treat –Nitin Rao is a blogger in the Indian markets, but he blogs in English at his brand new site Alpha Ideas. As regular readers know, I’m fascinated with the markets of emerging and frontier nations. As such, I’ve asked Nitin to write a guest post to reveal some not so well-known facts on the Indian markets. This is great stuff. – JB
***
10 Things You Need to Know About India’s Stock Market
1. Equity Averse: Indians are hugely equity averse. Only 1.2% of the Indian household financial savings is directly invested in shares (2010-2011). This amounts to a laughable figure of 2.5 Billion dollars for the entire Indian household population .
2. Low Participation: In a country of 1.2 billion, there are only 20 Million demat accounts (ed: a dematerialised account for individual Indian citizens to trade in listed stocks or debentures in electronic form) and 248 portfolio managers.
3. Foreigners vs Locals: Foreign Institutional Investors (FIIs) hold a larger stake in listed Indian companies (10.45%) than the combined stake of Indian Mutual Funds (2.68%) and Indian Financial Institutions/Insurance Companies (5.32%)
4. Inflows vs Outflows: In January -March of 2012, Foreign Institutional Investors (FIIs) invested $8.89 Billion in the Indian stock markets. In the same period, domestic institutions such as mutual funds, insurance companies etc sold around $4 Billion worth.
5. Total Market Cap to GDP: The current (2011) Market Cap to GDP ratio is around 86. In the last 19 years, the ratio ranged from a low of 25.1 (!) in 1992-93 to a high of 101 in 2007-2008.
6. Exchanges: The two main stock exchanges for Equity Trading in India are the Bombay Stock Exchange (BSE) and the National Stock Exchange (NSE). BSE is the oldest stock exchange in Asia and claims to have the largest number of listed companies in the world. However, of the 8900 scrips (stocks) listed, only about a third (around 3000) are traded every day.
7. Volume: The daily turnover in the Equity Cash segment of National Stock Exchange (NSE) is around $3 billion and that of Bombay Stock Exchange (BSE) is half a billion dollars. Three fourths (75%) of the turnover can be attributed to the top 100 scrips.
8. Derivatives: The National Stock Exchange (NSE) has a monopoly in the Equity Derivatives market. It ranks very high in global rankings for the number of contracts traded – 2nd in Stock Index Options, 3rd in Stock Index Futures and 3rd in Single Stock Futures. The daily turnover in the derivatives segment is around $30 Billion.
9. Brokers vs Algos: Around 70% of the trading volume is done by the top 100 brokers. Algorithmic and co-location trading accounted for about 25% of derivatives volume and around 30% of equities volume on the NSE and BSE.
10. Foreign Investors Now Welcome: Earlier foreign citizens were prohibited from trading directly in the Indian stock markets but since Jan 2012, these restrictions are withdrawn and now they are permitted to invest freely.
***
Thanks Nitin! I have a theory that frontier and emerging market stocks have their biggest moves upon the moment of discovery and the floodtide of liquidity. We’ve seen it with the BRICs and with Eastern Europe and Latin America. In the next decade, I believe India will be re-discovered now that it’s opening its markets up to outside capital in this way, I am just as excited about India as I am about Africa.
Visit Nitin Rao’s new site AlphaIdeas.IN today!


clearwater slots https://www-slotmachines.com/
play free lucky 777 slots https://slotmachinegameinfo.com/
dissertation writing guides https://buydissertationhelp.com/
all but dissertation https://dissertationwriting-service.com/
biology dissertation help https://mydissertationwritinghelp.com/
dissertation writing services https://dissertations-writing.org/
dissertation writing services uk https://helpon-doctoral-dissertations.net/